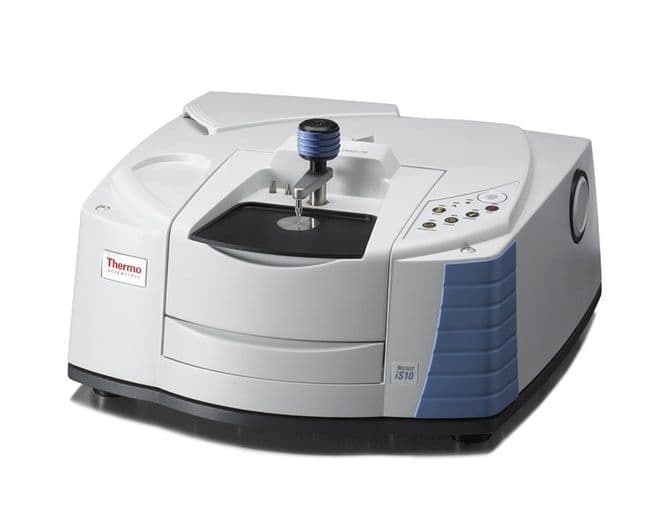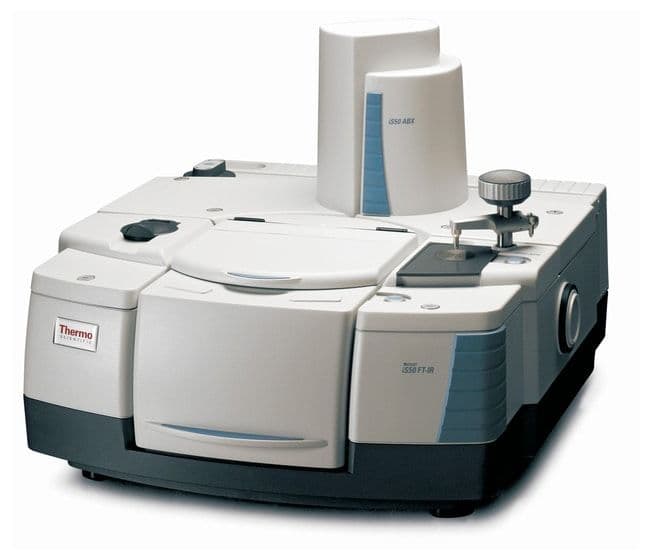
Nicolet™ Summit FTIR 光谱仪
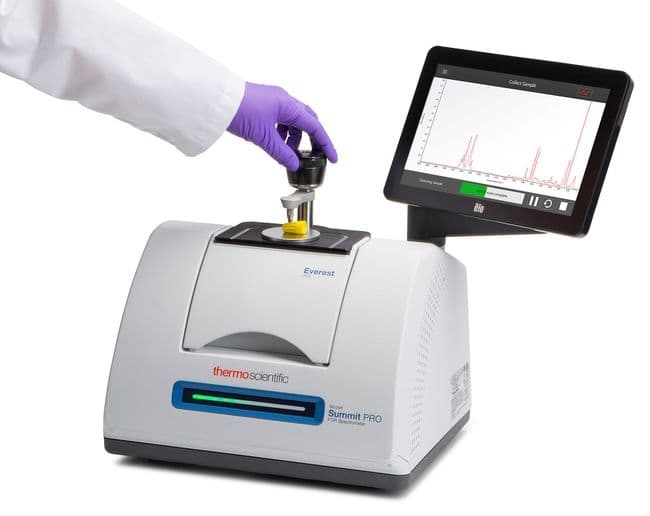
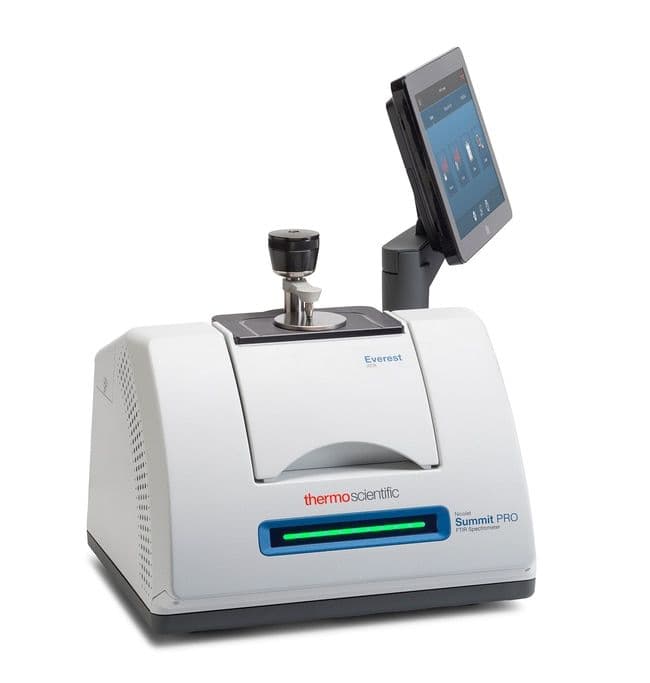
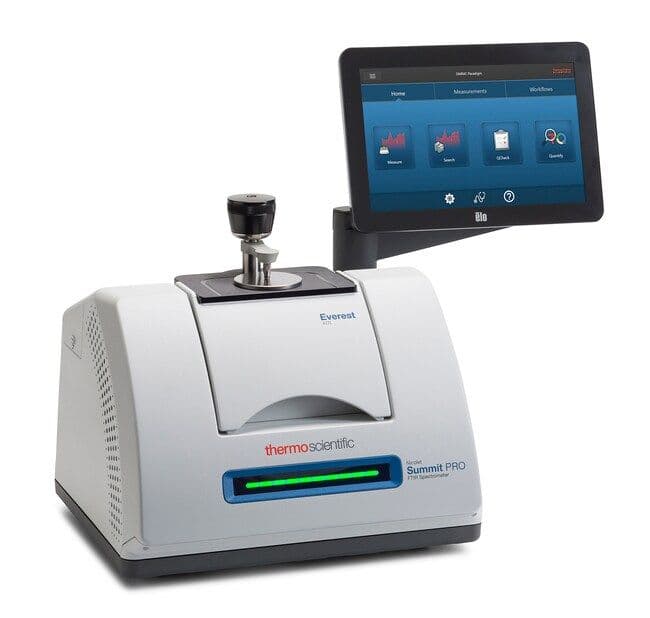
使用 FTIR 光谱仪在实验室中获得巅峰级的生产率,通过自动化工作流程对材料进行快速验证。Wi-Fi 和以太网连接使数据分享更加简单。 多色 LED 灯带快速查看通过/失败结果。触摸屏界面节省工作台空间。
森德仪器提供 赛默飞/Thermo Fisher Nicolet™ Summit FTIR 光谱仪 在全国范围内的代理经销、选型咨询、报价沟通、采购支持、安装培训和售后协同服务,价格面议。

微信扫码沟通
扫码添加技术顾问,发送产品型号或应用需求。
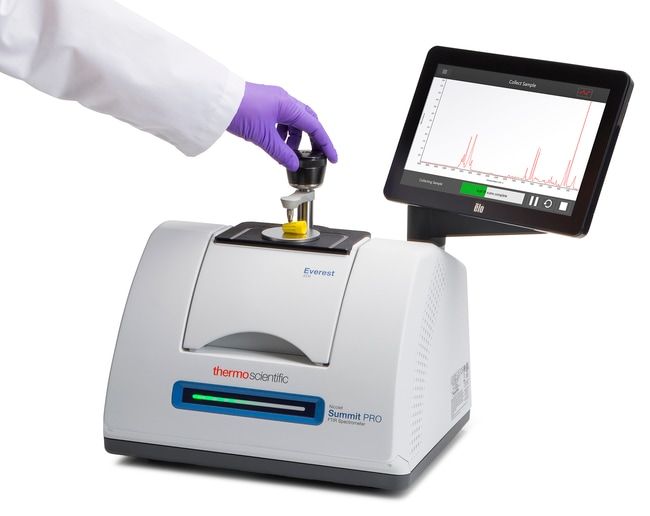
自信轻松地鉴定样品组分,并轻松、快速地验证材料,使您可以快速作出重要决策。使用紧凑型 Thermo Scientific™ Nicolet™ Summit FTIR 光谱仪,通过仪器正面的多色 LED 灯带快速查看合格/不合格 QC 结果。Thermo Scientific™ OMNIC™ Paradigm 软件在内置 Windows™ 计算机上运行,减少进行测量、自动化工作流程和生成报告的步骤。通过 Wi-Fi 连接在云端发送和共享数据。此光谱仪是繁忙的 QA/QC 实验室和教学实验室的理想选择。
Nicolet Summit FTIR 光谱仪可帮助您的生产率达到新的高度,让您在更短时间内完成更多工作。这款紧凑型 FTIR 光谱仪在设计和功能上均超越了我们之前的 Nicolet iS5 FTIR 光谱仪,无论您是管理 QA/QC 实验室还是拥挤的大学生教学实验室,它都可以满足您繁忙、多用户实验室的需求。
可靠的高性能光学元件
为了实现极佳的可靠性和准确性,Nicolet Summit FTIR 光谱仪采用我们独特的 LightDrive 光学引擎设计而成。
软件可缩短您的工作日
OMNIC Paradigm 软件的用户友好界面(触摸屏或台式计算机)可简化实验室操作,编程应用程序可简化数据采集、处理和解读。


采购问答
<p>In Raman spectroscopy, an unknown sample of material is illuminated with monochromatic (single wavelength or single frequency) laser light, which can be absorbed, transmitted, reflected, or scattered by the sample. Light scattered from the sample is due to either elastic collisions of the light with the sample's molecules (Rayleigh scatter) or inelastic collisions (Raman scatter). Whereas Rayleigh scattered light has the same frequency (wavelength) of the incident laser light, Raman scattered light returns from the sample at different frequencies corresponding to the vibrational frequencies of the bonds of the molecules in the sample.<br/><br/> If you wish to learn more about Raman spectroscopy, visit our online Raman Spectroscopy Academy (https://www.thermofisher.com/us/en/home/industrial/spectroscopy-elemental-isotope-analysis/spectroscopy-elemental-isotope-analysis-learning-center/molecular-spectroscopy-information/raman-technology.html), where you will find basic Raman tutorials, advanced Raman webinars on sample applications, and a helpful instrument guide.</p>
<p>The Beer-Lambert law is based on stable samples and reproducible conditions. In ATR, you have two concerns. First, the sample must make contact with the crystal in a consistent manner. If the material is rough or crystalline, you must ensure reproducibility. Grinding the material to a fine powder may be necessary. Second, ATR is a surface technique, examining the sample to a depth of around 1-4 microns. If the additive or target molecule is migrating further away, you will lose the signal. In this case, transmission, which illuminates the entire sample and entire thickness, may be a viable option (depending upon thickness). In some cases, the application of pressure can change the signal due to changes in the crystallinity or orientation of polymer strands in the sample. Any deeper insights would require an understanding of the specific sample involved.</p>
Sende Lab
当前页面用于确认具体仪器型号、参数和采购沟通;如果要从行业热点、测试标准、实验室建设和验收资料角度规划整套能力,可继续查看 Sende Lab。
请填写必填信息,我们将在工作日尽快回复。
<p>One key experimental step in protein analysis is the removal of the water bands (most proteins are in buffers). This requires highly controlled path-length transmission cells or ATR. Most historical work was done in 6-10 micron path length transmission cells using BaF2 or similar windows. The analytical region is roughly between 1400 and 1750cm-1 where these windows are transmissive. Recently, ATR devices using silicon, germanium, or diamond windows have become more prevalent. Reactions or binding of proteins to the crystal can occur with ZnSe devices (due to surface charges); sometimes this is desired but often it is not. Most of the literature is based on transmission cells. Protein analysis requires skill and consistency, so training is essential for most laboratories.</p>
<p>DRIFTS is used in both mid-IR and near-IR. In the mid-IR, DRIFTS requires the sample be blended with diluents like KBr, with 3-10% sample. This is typically undesirable as the sample is now mixed. However, DRIFTS is heavily used in catalysis research where powdered material is exposed to high temperature, elevated pressures, and mixtures of reactant gases. Several accessory suppliers make devices specific for this. In the near-IR, DRIFTS is used without dilution through direct measurement - many hand-held probes exist allowing analysis through a container wall (like plastic bags) meaning the sample can be analyzed without touching or contaminating it. <br/><br/> ATR involves making contact with the sample by forcing it into contact with a crystal. ATR generally does not require dilution and works well with solids like credit cards or car bumpers which would be tough in DRIFTS. ATR has, for the most part, displaced DRIFTS in the mid-IR except in special cases, while DRIFTS remains a method of choice in the near-IR world.</p>
<p>Fourier Transform Infrared Spectroscopy (FTIR) responds to a change in dipole moment, regardless of whether it is organic or inorganic. Metal oxides, carbonates, and carbonyls are good examples. The basic equation states that the wavenumber is proportional to the square root of the spring constant (bond strength) and one over the square root of the reduced mass. Simply put, as mass of the atoms involved in the bond goes up, the wavenumber goes down. Many inorganics have peaks below 400cm-1, such as ferrocene, acetylferrocene and cadmium oxide. This necessitates the use of “far-IR” optics. Many forensics users have found far-IR useful in identifying paint chips, due to their inorganic content. There are several ATR accessories that now permit far-IR ATR (mostly monolithic diamond devices). The Thermo Scientific Nicolet iS50 FTIR Spectrometer was designed to make far-IR performance trivial with a built-in ATR as well. Ultimately, if you have further interest in this area, you need to speak with an FTIR sales person to understand the capabilities and limitations.</p>
<p>Quantitative work requires one of two approaches. First, you may know or can calculate the absorptivitiy (the epsilon in Beer's Law). This is exceedingly rare. Much more commonly, you can develop a set of training / calibration standards and record spectra. You can then either use a chemometrics package like Thermo Scientific TQ Analyst software to automate the analysis using Beer's Law or more complex modeling, or you can record basic information (peak height or peak area) in a spreadsheet and then use linear (or non-linear) regression. It is generally the same idea as done for chromatography or atomic spectroscopy.</p>
<p>Apodization can increase from light (like Happ-Genzel) to heavy (like Blackman-Harris). The heavier the function, the more effect you will see on lineshape. For most normal uses, when the resolution is 4 wavenumbers or more, even heavy apodization does not distort spectra badly. However, as the lines narrow, as in gas-phase spectroscopy, the effect of apodization can be profound. Strong apodization in broad peaks improves the signal to noise ratio over Boxcar (essentially no apodization) by a lot with minimal effect on linewidth. Happ-Genzel was the original OMNIC default (and still often is) due to its “gentle” effect on linewidth coupled with decent signal to noise ratio. Generally, signal to noise ratio improves in the order Happ-Genzel, Norton-Beer-Weak, Norton-Beer-Medium, Norton-Beer-Strong, Blackman-Harris, while lineshapes are also affected more in the same order.</p>
<p>Apodization works on the interferogram. If you have that raw data, which Thermo Scientific OMNIC software can do by setting a single check box, then post-processing by changing apodization is trivial. The interferogram typically requires a lot more memory than the Fourier transformed spectra, so older software packages used to throw away the interferogram to save memory. In cases where the interferogram is not present, you can't reprocess as apodization is a time domain function.</p>
<p>Presenting spectra as transmittance tends to emphasize the smaller peaks, so you can sometimes visually assess your sample better. Absorbance spectra are used for any quantitative analysis, spectral subtractions or other manipulations as the spectra are linear with concentration whereas transmittance spectra are not. For searching or more general use, it is really more of a personal preference. Older literature tended to use transmittance most often, while detailed peak analysis always moved to absorbance, again because of the linearity feature.</p>